Student Progress Detail


The Student Progress Detail report is available at the teacher and student levels. It displays all work a student has completed in iPASS sequentially. In the example below, the report is shown at the teacher level.
To access the Student Progress Detail report, log in at www.iLearn.com/login and click LMS hub icon Reports.

iLearn Hub Teacher View

Reports Home Screen Teacher View

The Reports open in a new window.

Under iPASS, click “Student Progress Detail.”

Reports ipass Card

DataReports_Student_Progress_Detail_1

The Student Progress Detail report will display one student at a time.

  1. Select Class - Click “Select Class” and choose a class.
    1. Select Student-Choose the student from the alphabetical list.
  2. Export – Export to PDF Reports Export PDF . Export to Excel Reports Export Excel.
  3. View Report - Always click “View Report” after making changes.

DataReports_Student_Progress_Detail_2

The Student Progress Detail report displays all elements a student has completed in iPASS. Use the on the left to expand units and chapters to view more data. Use the to collapse units and chapters to see summarized data.

The column headers describe the data being displayed:

  1. PT – Placement Test scores

Unit
  1. UC/P - Unit Challenge Passed. Displays scores for successful challenges of Units.
  2. UC/F - Unit Challenge Failed. Displays scores for unsuccessful challenge of Units.
  3. UM - Unit Mastery. Displays scores for successful mastery of Units. Compare Unit Mastery score to the corresponding Unit Challenge Failed score.
  4. Atts - Attempts. Displays the number of times the student took the Unit Mastery Test.


Chapter
  1. CC/P - Chapter Challenge Passed. Displays scores for successful challenges of Chapters.
  2. CC/F - Chapter Challenge Failed. Displays scores for unsuccessful challenge of Chapters.
  3. CM - Chapter Mastery. Displays scores for successful mastery of Chapters. Compare Chapter Mastery score to the corresponding Chapter Challenge Failed score.
  4. Atts - Attempts. Displays the number of times the student took the Chapter Mastery Test.


Lesson
  1. P/F - Stands for Pass/Fail and will display P, F, or B (pass, fail, or bypass). P - Student passed the Lesson Challenge Quiz. F - Student failed the Lesson Challenge Quiz. B - Student chose to bypass (skip) the Lesson Challenge Quiz and go directly in to the Lesson Instruction.
  2. Atts - Stands for Attempts and will display the number of times the student took the Lesson Instruction before passing.


Fluency
  1. Pre­ - Stands for Pretest and will display the number of digits correct the student achieved on the Chapter Challenge Test for a fluency chapter.
  2. Post - Stands for Posttest and will display the number of digits correct the student achieved on the Chapter Mastery Test for a fluency chapter.
  3. Req - Stands for required and will display the number of digits correct the student must meet to pass either the Chapter Challenge Test or the Chapter Mastery Test for a fluency chapter.
  4. Date Comp. - Stands for Date Completed and will display the date the student completed the element listed for that row.

DataReports_Student_Progress_Detail_3

The student’s gaps chart appears at the top. Hovering the cursor over the chart will provide additional information on the unit or chapter number and the chapter title.
  1. Class Gaps Exempted 
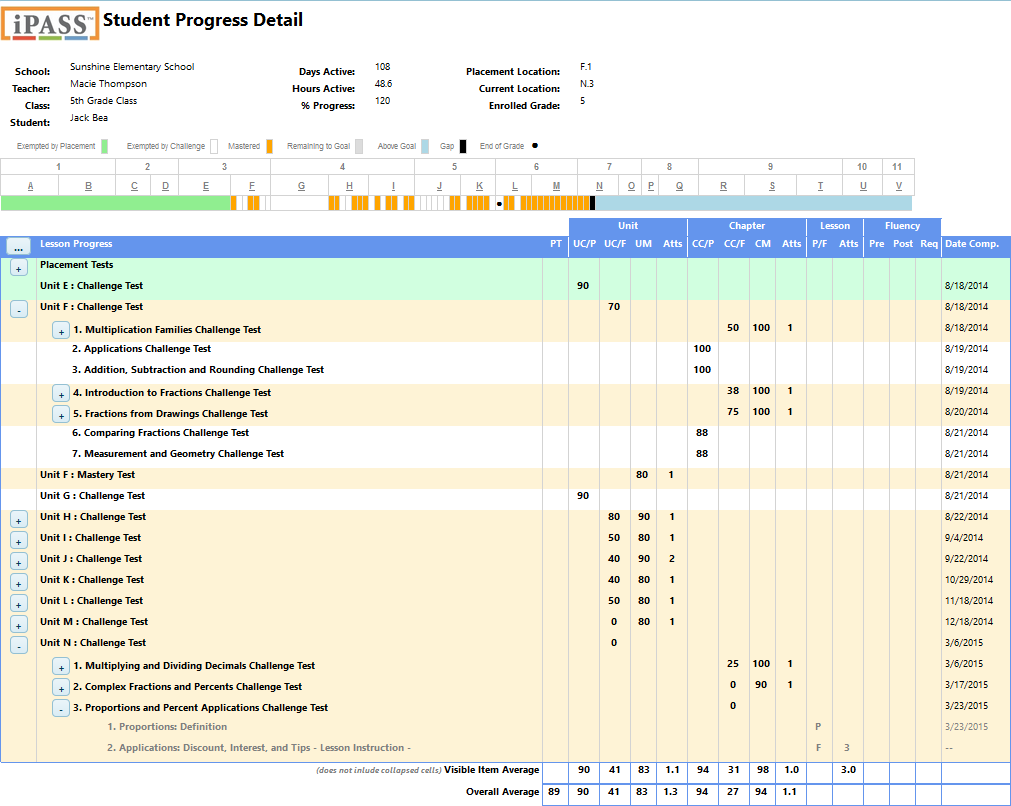
Green represents all content exempted in the Placement Test process (the initial Placement Test continues as students successfully challenge Units, Chapters and Lessons, and concludes when the student does not successfully challenge the first Lesson Challenge Quiz, i.e. sees the first Lesson Instruction).
  2. DataReports_Class_Gaps_Chart_White White represents all content the student exempted by successfully challenging the Unit Challenge or Chapter Challenge Tests.
  3. DataReports_Class_Gaps_Chart_Orange Orange represents each chapter of content mastered by passing the Chapter Mastery Test. These are Chapters in which the student needed at least one lesson.
  4. DataReports_Class_Gaps_Chart_Gray Grey represents content the student needs to complete to reach a goal of 100%.
  5. DataReports_Class_Gaps_Chart_Blue Blue represents content above the student’s enrolled grade level. For the example above, all chapters in the Units N, O, P and Q are above the student’s grade level. The student can continue learning beyond grade level with no program restriction.