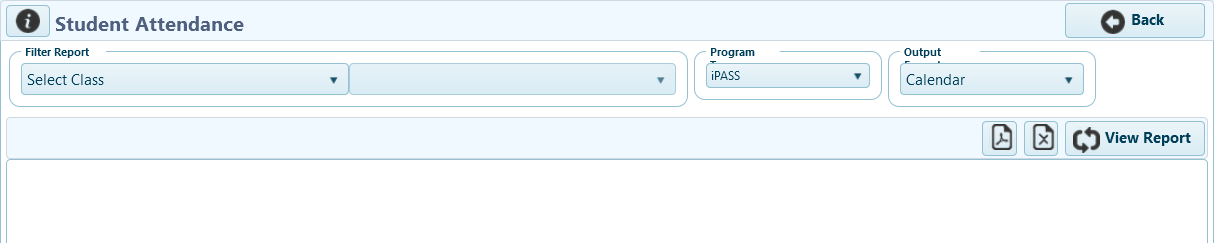
The Student Attendance report is available at the teacher and student levels. It displays an individual student’s attendance data for iPASS in either a calendar or table view.
To access the Student Attendance report, log in at www.iLearn.com/login and click
Reports.
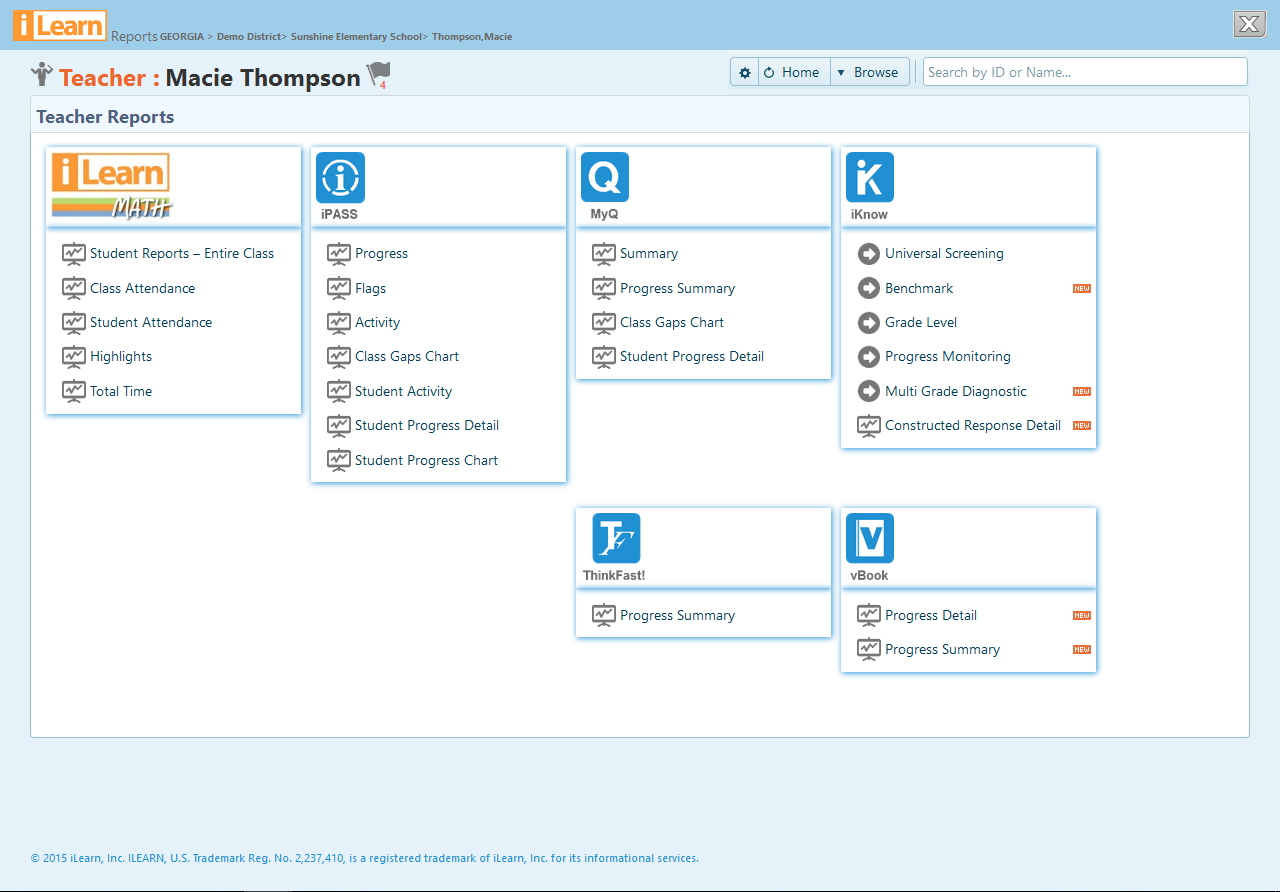
The Reports open in a new window.
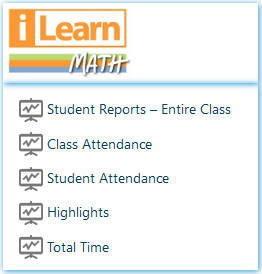
Under iLearn Math, click “Student Attendance.”
Select Class - Click “Select Class,” then choose the class.
Select Student - Select student from the alphabetical list.
Output Format - Select the report type to view.
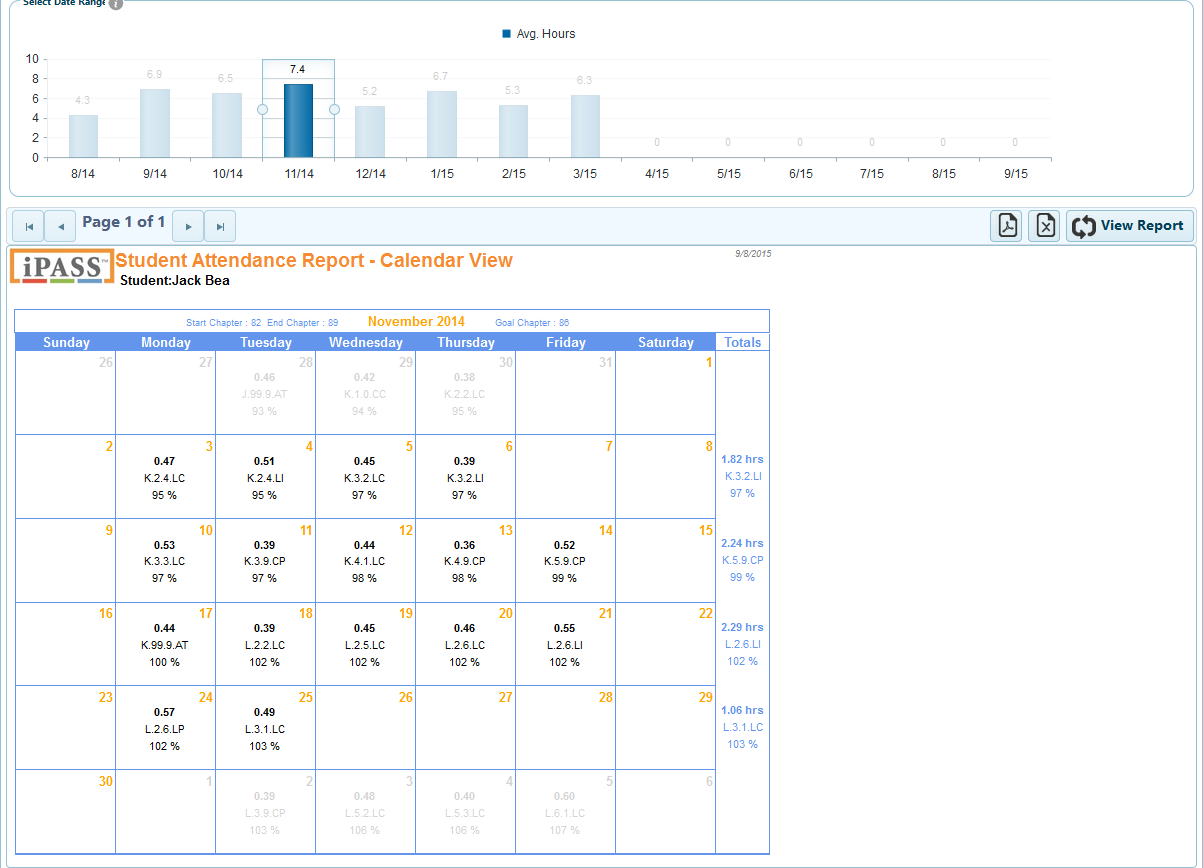
Calendar - Displays a calendar month view (see below)
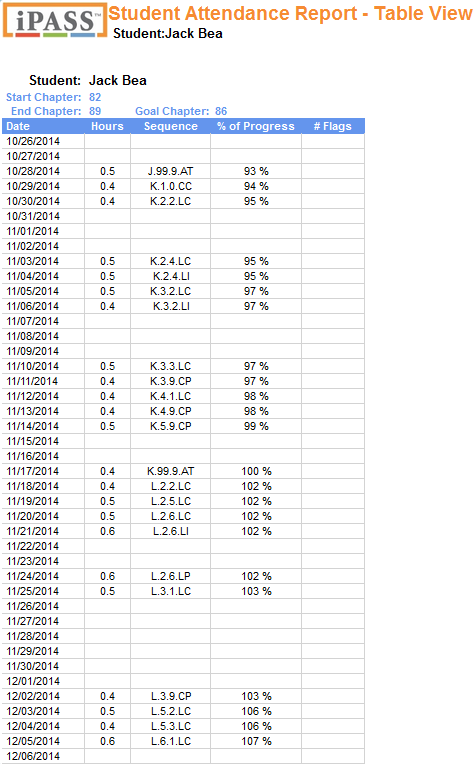
Table - Displays a table of student’s attendance by day (see below)
View Report - Always click “View Report” after making changes. A reminder will display in which you can click “View Report.” Select the next student and “View Report” etc.
Export – Export to PDF
. Export to Excel
.
Select Date Range - Scrolling over the “i” on the left will provide additional instructions. To select, click and drag the left and/or right side with the circular “handles” to include the desired range. Then click “View Report” to see the first student on the list. Click
Start Chapter - starting sequential chapter number for the month
End Chapter - ending sequential chapter number for the month
Goal Chapter - chapter at the end of the student’s enrolled grade level
Attendance Data - The first line in the day is the hours of activity for the day. The second line shows is the last location for the day. The third line shows the cumulative percent progress toward goal of 100% (by sequential chapter). The last line if present, shows the number of progress flags the student had for the day.
Totals - The column to the right displays total hours activity for the week, the last location, and the ending percent progress toward the goal of 100%.
To view the same data described above, in a table view, change the Output Format to “Table” and click “View Report.”
The Calendar and Table view show the same data for the same date range selected. Use the Table view when you want to export the student’s attendance data to excel.