Q Progress Summary


The Q Progress Summary report is available at the teacher level. It allows a teacher to view each students activity in a selected queue.
To access the Q Progress Summary report, log in at www.iLearn.com/login and click LMS hub icon Reports.

iLearn Hub Teacher View

DataReports_Homescreen_DAdmin

The Reports open in a new window.

Under MyQ, click “Q Progress Summary.”

Reports myq Card

DataReports_Q_Progress_Summary_1

First select a class and a queue.

  1. Select Class - Click to select a class.
  2. Select Queue - Click to select a queue.
  3. Options
    1. Select Queue Type - Accept the default “All,“ or choose between“Homework” and “Learning Progression” queues.
    2. Select Student - Accept “All Students” or click specific students.
    3. Report Type - Accept the default “Both,” or choose between Chapters Only and Lessons Only.
  4. View Report - Always click “View Report” after making changes.
  5. Export – Export to PDF Reports Export PDF . Export to Excel Reports Export Excel.

DataReports_Q_Progress_Summary_2
  1. Student - name of the student
  2. Q Hrs - hours of activity in selected queue
  3. % Q Complete - percent of elements (such as LI, LP) in the queue that are completed
  4. Last in Q - last date of activity in the selected queue
  5. Chapter Title - chapter name in which the lessons of the queue are located
    1. Lesson Title - name of the lesson in the program
  6. Element - May display CC (Chapter Challenge), LC (Lesson Challenge Quiz), LI (Lesson Instruction), LP (Lesson Practice), CP (Chapter Practice), and CM (Chapter Mastery)
  7. Metrics
    1. Exempted - number of students exempting the element of that column
    2. Completed - number of students completing the element of that column
    3. In Progress - number of students with activity in, but not completing the element of that column
    4. Not Started - number of students not starting the element of that column
    5. Not Assigned - number of students not assigned to the queue
  8. Key
    1. DataReports_Class_Gaps_Chart_Green 
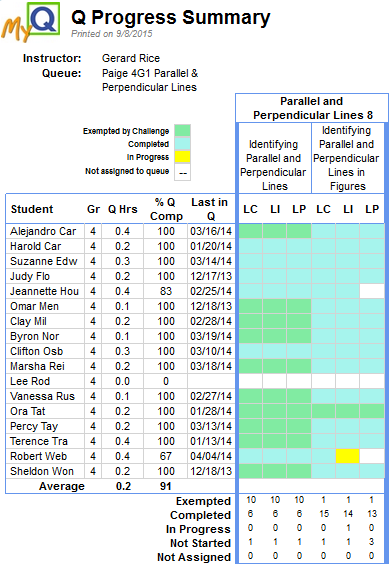
Exempted by Challenge - Green displays when a student exempts the element(s) by passing the challenge. The entire chapter is green when a student passes the Chapter Challenge Test, and the entire Lesson is green when the student passes the Lesson Challenge Quiz.
    2. DataReports_Class_Gaps_Chart_Blue Completed - Blue displays when a student completes the element.
    3. DataReports_Class_Gaps_Chart_Yellow In Progress - Yellow displays when the student starts but does not complete the element.
    4. Not Started - White displays when a student has started the element.