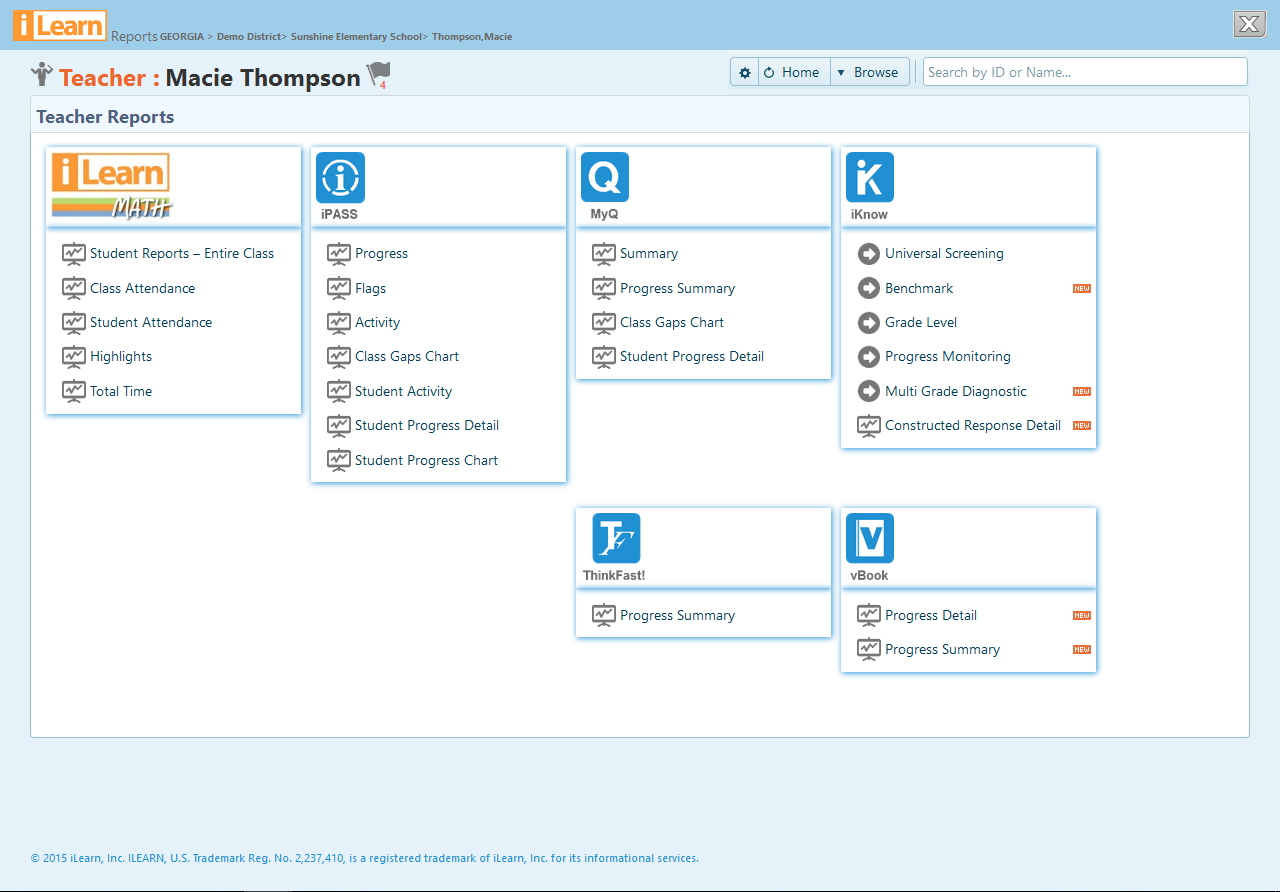
The Summary report for MyQ is available at the teacher and school administrator levels. It displays all queues assigned to students, metrics and completion status. In the example below, the report is shown at the teacher level.
To access the Class Screening Detail report, log in at www.iLearn.com/login and click
Reports.
The Reports open in a new window.
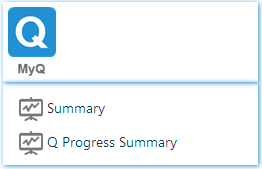
Under MyQ click “Summary.”
The MyQ summary report is different from most of the data reports, in that it can be grouped by Queue, by Class, or by Student.
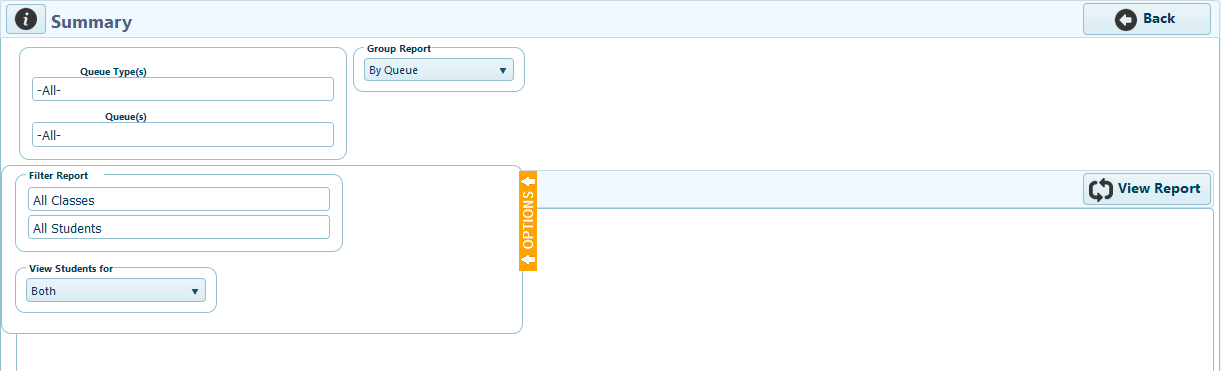
Below is an example of the MyQ summary filters and options:
Queue Type - Select to view All queue types, just Homework/Classwork queues, or iLearn Learning Progression queues.
Queue - Select one or multiple queues. Remove queues by clicking the “x” next to the name.
Group Report - Change the group to report by Queue, Class, or Student.
Options - Specify the exact data to view.
Select Class(es) - Select one or multiple classes. Remove classes by clicking the “x” next to the class.
Student(s) - Select one or multiple students. Remove students by clicking the “x” next to the name.
View Report - Always click “View Report” when you have altered the options.
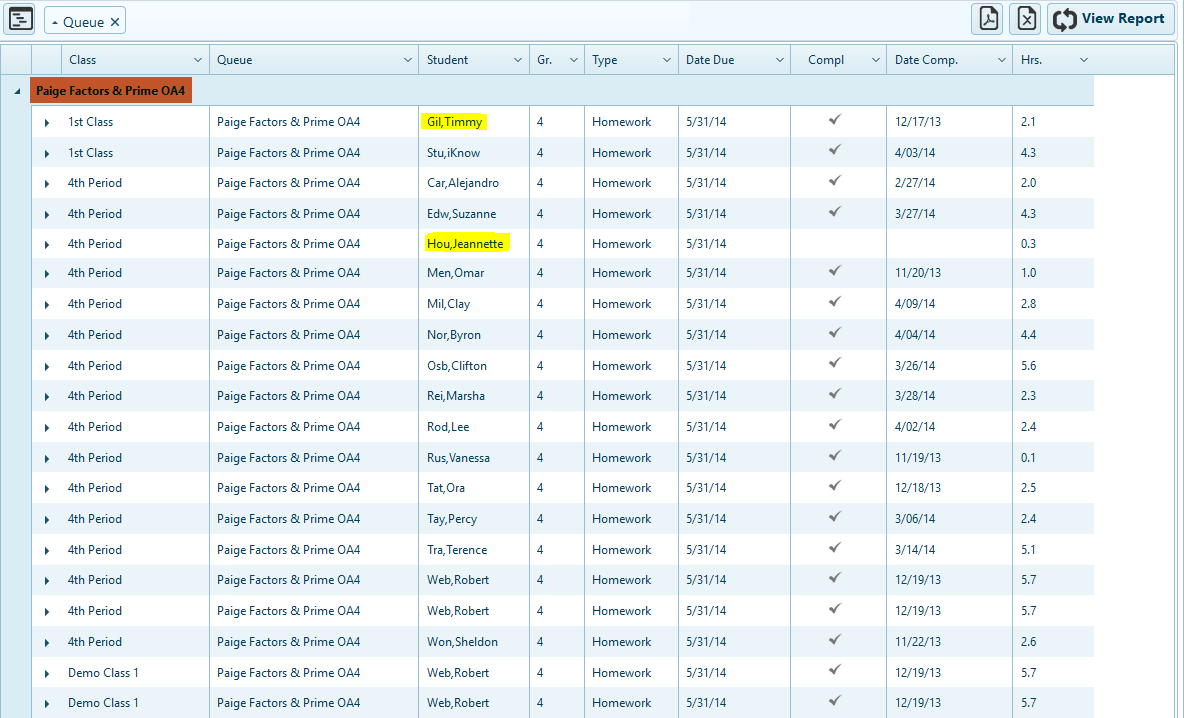
The information the column headers indicate:
Class - Name of the class
Queue -Name of the queue
Student - Name of the student assigned to the queue
Gr. - Enrolled grade level of the student assigned to the queue
Type - Type of queue - Homework/Classwork or iLearn Learning Progressions
Due Date - Due date of the queue (can be extended for one or many students in the MyQ Manager)
Status - Checkmark verifies the student completed all elements in that queue
Date Comp. - Date the student completed the last element in the queue
Hrs. - The time in hours the student was active in that queue
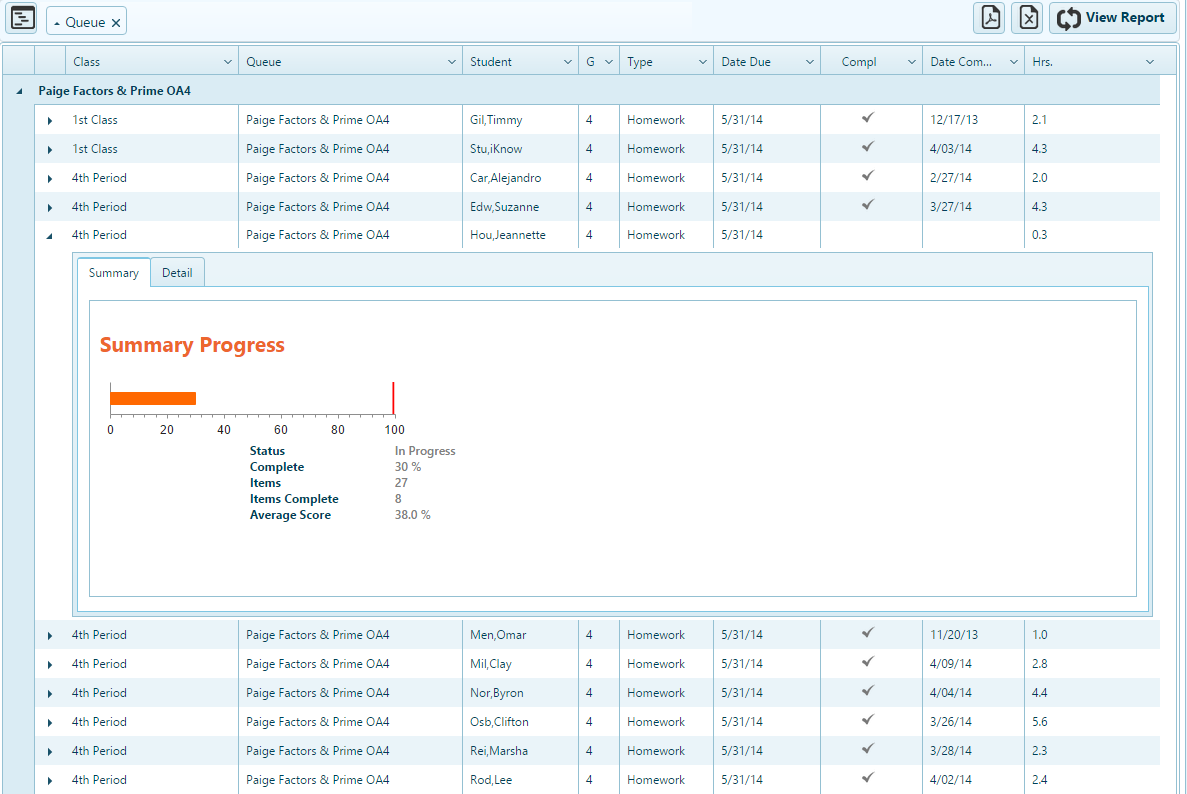
The default filter for the MyQ Summary report is by Queue, sorted alphabetically.
In the example to the left, the queue names are in red and two student names are in yellow. Under each queue are listed the students assigned. Since students can be assigned to more than one queue, students may be listed under multiple queues. Notice Josh appears under the first and second queue, as assigned.
If the report is grouped by Class, classes in alphabetical order display each student along with each of the student’s assignments. Grouping by Student displays all students in alphabetical order.
Expand this report to show details by clicking the arrow to the left of each row. Details include the percent complete, and number of items completed out of the total number of items. If the queue includes no tests, “n/a” displays for “Average Score.” For Learning Progression Queues and chapter level Homework/Classwork queues, Average Score will display the average for paired challenge and mastery tests, but only for pairs of tests in which a Challenge and Mastery test was completed.
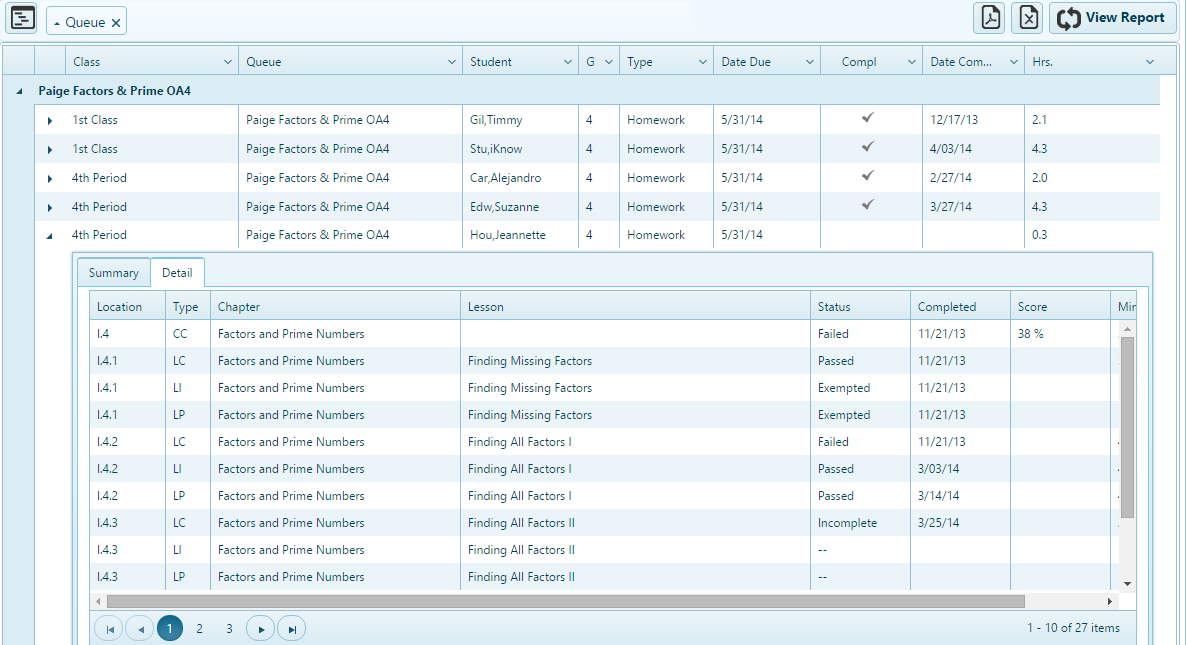
The “Detail” tab displays a more detailed breakdown of the student’s work: here we see the queue “Counting and Comparing Numbers 0-10.” Each element such as Lesson Challenge and Lesson Instruction is listed. The columns indicate important data for each element:
Location - Location of the element in iPASS/MyQ.
Standard - The associated standard.
Type - The element type. It will display:
CC - Chapter Challenge Test
CM - Chapter Mastery Test
LC - Lesson Challenge Quiz
LI - Lesson Instruction
LP - Lesson Practice
CP - Chapter Practice
Chapter - Name of the chapter in the iPASS/MyQ program.
Lesson - Name of the lesson in the iPASS/MyQ program.
Status - Displays “Passed”, “Failed”, “Bypassed”, or “Exempted.” Passed on a challenge quiz or test indicates a sufficient score to exempt all elements in the lesson, or lessons in the chapter. Failed indicates the challenge or mastery criterion was not met. Bypass indicates a student chose not to take the lesson challenge quiz (LC) and to proceed directly to the lesson instruction (LI) and lesson practice (LP). Exempted indicates elements in a lesson or lessons in a chapter that were exempted by a successful challenge of a lesson challenge quiz or chapter challenge test.
Completed - Date of completion.
Score - Displays the % correct for Chapter Challenge and Mastery Tests.
Minutes - Time in minutes the student spent in each element.
Notice the page numbers at the bottom of the “Detail’ tab:
. To view each element of an extended queue, click the arrow next to the page numbers.
Use this report to track student progress in an assigned queue, and to see how students are performing on individual elements in a queue.


 . To view each element of an extended queue, click the arrow next to the page numbers.