iSupport K12 Home
Activity
Attendance Report
Benchmark Summary
Class Benchmark Detail
Class Gaps Chart
Class Grade Level Test Detail
Class Screening Detail
Completion Report
District Roster
Flags
Grade Level Test Summary
Highlights
MyQ Detail
MyQ Summary
Progress Detail
Progress Monitoring Detail by Assessment
Progress Monitoring Detail by Class
Progress Monitoring Detail by Student
Progress Monitoring Summary by Student
Progress Summary
Progress
Q Progress Summary
Screening Summary
Student Activity
Student Attendance
Student Benchmark Detail
Student Grade Level Test Detail
Student Progress Chart
Student Progress Detail
Student Screening Detail
Student Summary - iPASS
Student Summary - ThinkFast
Student Test Scores
TF Progress Summary
Topic Test Scores Detail
Topic Test Summary
Total Time
Group A Title
Group A Sub 1 Title
Group A Sub 2 Title
Group B Title
Group B Sub 1 Title
Group B Sub 2 Title
Group C Title
Group C Sub 1 Title
Group C Sub 2 Title
Group D Title
Group D Sub 1 Title
Group D Sub 2 Title
Highlights
The Highlights report is available at the teacher level only. It enables teachers to monitor student activity in real time.
To access the Highlights report, log in at
www.iLearn.com/login
and click
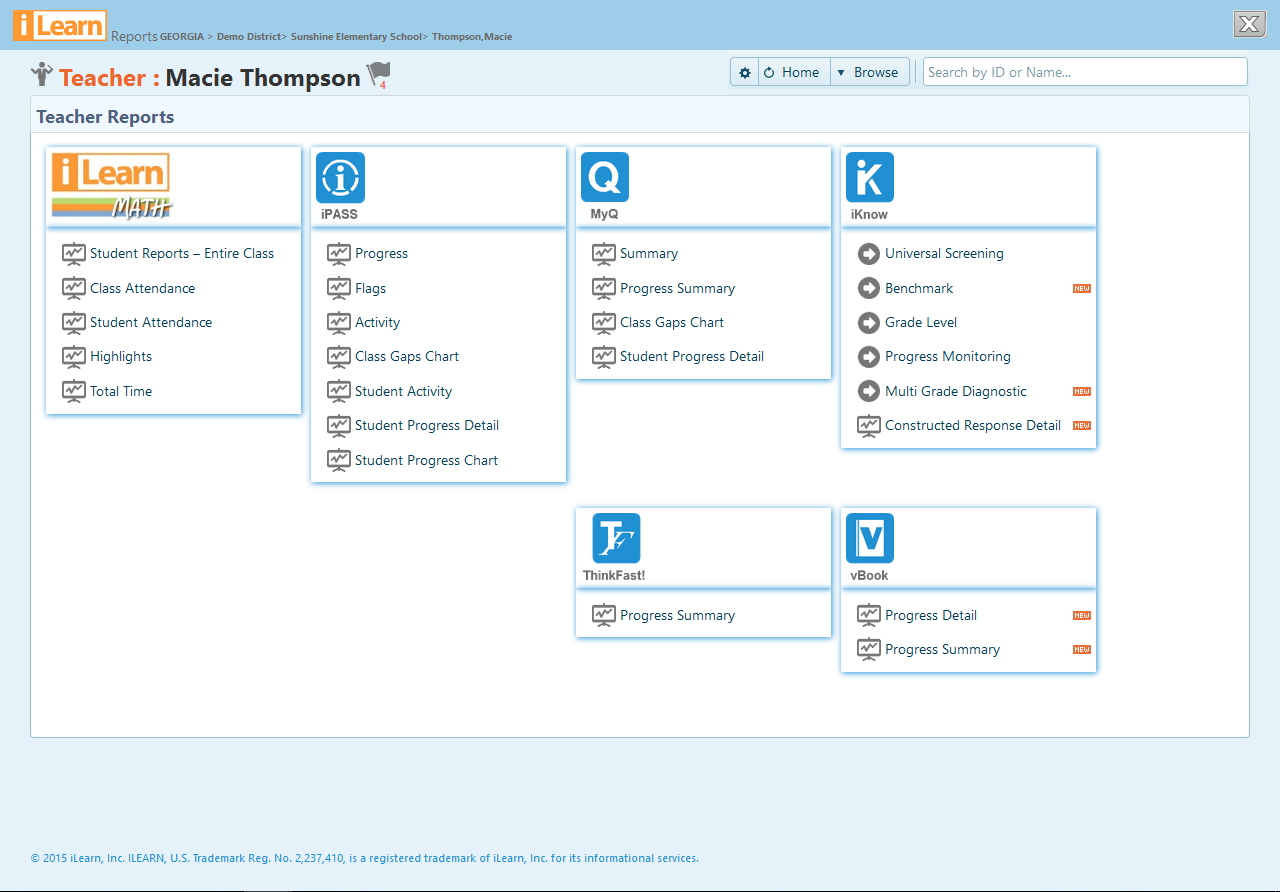
Reports.
The Reports open in a new window.
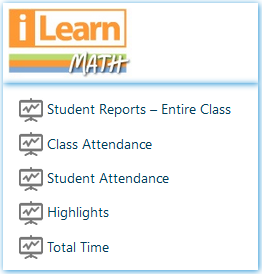
Under iLearn Math, click “Highlights.”
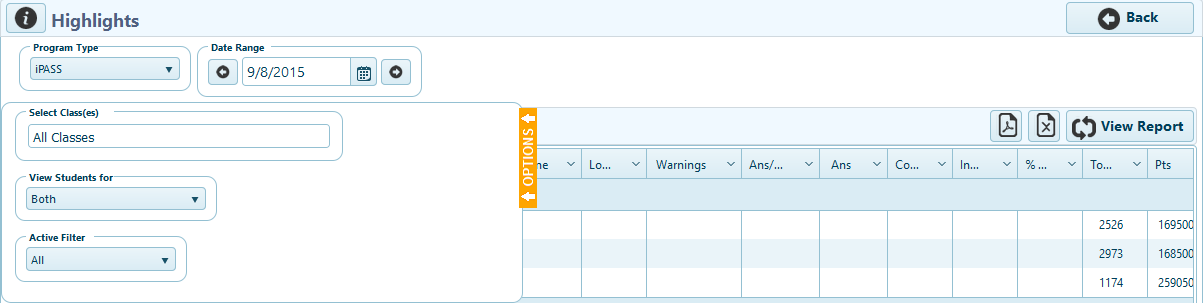
The Highlights report displays by program, and all five programs have a similar Highlights report.
Program Type –
Choose the program to view activity for the selected day.
Date –
Select a specific day to view. The default is the current day, but previous days can be selected.
Options –
Alter the options to change what is viewed in the report.
Select Class(es) –
View all classes, multiple classes, or view just one class.
View Students for –
Choose to view students for Teacher of Record, Virtual View, or both (the default).
Active Filter –
Choose to view only students with activity on the day selected, only students with no activity, or all students (the default).
Export –
Export to PDF
. Export to Excel
.
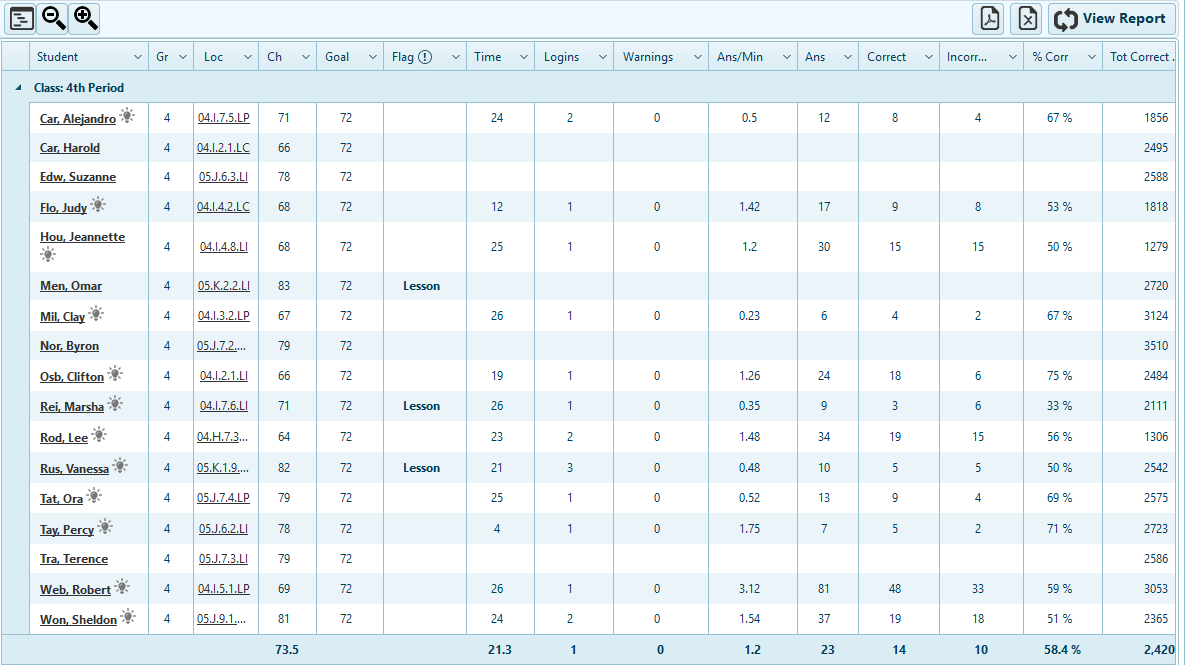
The iPASS Highlights report displays the following, for the day selected unless otherwise indicated:
Student -
Name of the student
Gr –
The student’s enrolled grade level
Location –
The current location in iPASS
Chap # -
The current chapter number in a numeric sequence from the first chapter to the last chapter in iPASS
Goal –
The chapter number in the sequence representing the last chapter in a student’s grade level
Flag –
Progress Flag in iPASS if applicable - blank if the student has no Progress Flag
Time –
The time in minutes of activity in iPASS
# Logins –
The number of times the student logged into iPASS
Logout Warnings –
The number of logout warnings the student received in iPASS
Ans/Min –
The number of answers per minutes the student entered in iPASS
Tot Ans –
The total number of answers the student entered in iPASS
Correct Ans –
The total number of correct answers the student submitted in iPASS
% Correct –
The percent correct answers entered by the student in iPASS
Total Points –
The student’s total number of correct answers in iPASS to date
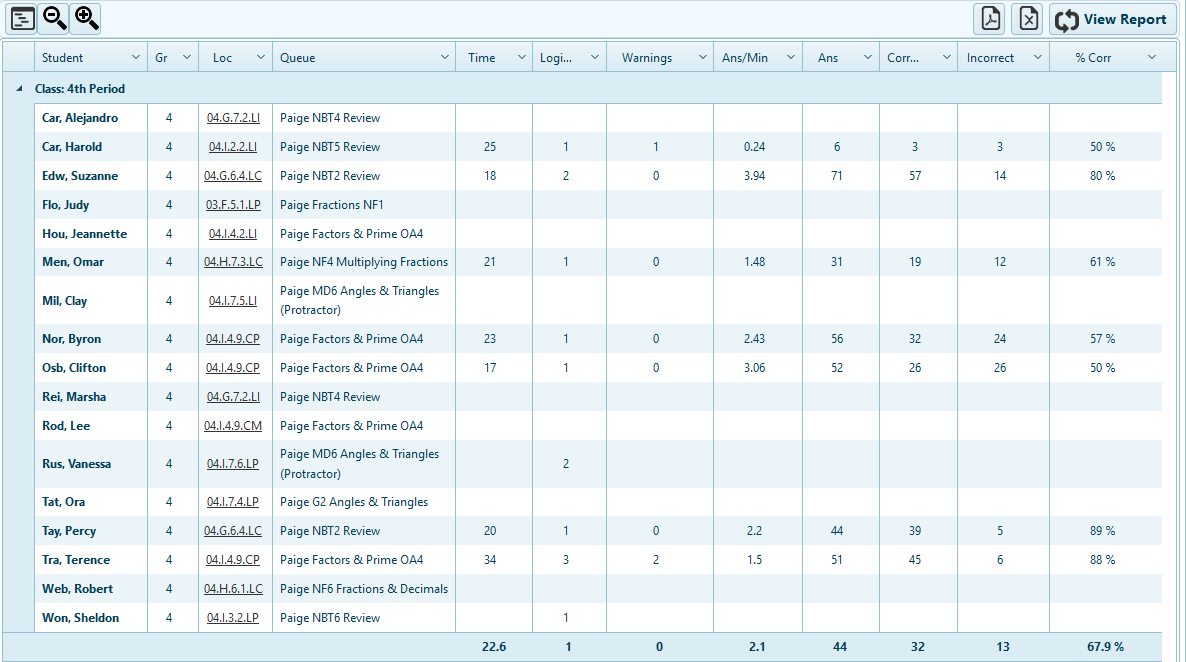
The MyQ Highlights report displays the following, for the day selected unless otherwise indicated:
Student -
Name of the student
Grade –
The student’s enrolled grade level
Location –
The current location of the student
Queue –
The name of the queue of current student activity
Time –
The time in minutes of activity in MyQ
# Logins –
The number of times the student logged into MyQ
Logout Warnings –
The number of logout warnings the student received in MyQ
Ans/Min –
The number of answers the student entered in MyQ
Total Ans –
The total number of answers the student entered in MyQ
Correct Ans –
The total number of correct answers the student entered in MyQ
% Correct –
The percent correct answers entered by the student in MyQ
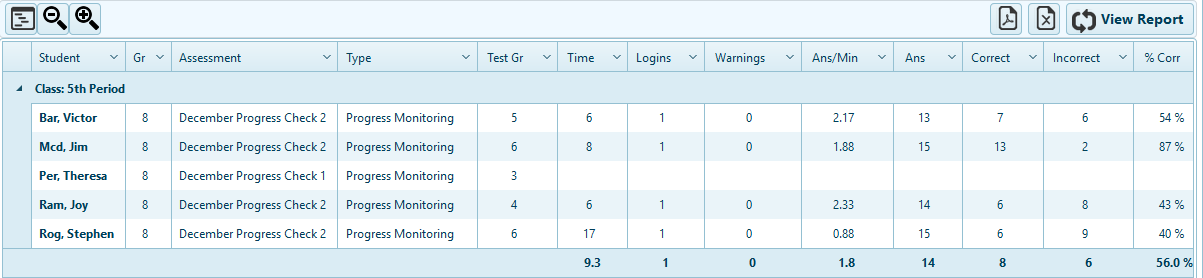
The iKnow Highlights report displays the following, for the day selected unless otherwise indicated:
Student -
Name of the student
Gr -
The student’s enrolled grade level
Assessment -
The iKnow assessment of current student activity
Type -
The type of iKnow assessment
Test Gr -
The grade level of test the student is currently in
Time(Min) -
The time in minutes of student activity in iKnow
# Logins -
The number of times the student logged into iKnow
Logout Warnings -
The number of logout warnings the student received in iKnow
Ans/Min -
The number of answers the student entered in iKnow
Total Ans -
The total number of answers the student entered in iKnow
Correct Ans -
The total number of correct answers the student entered in iKnow
% Correct -
The percent correct answers entered by the student in iKnow
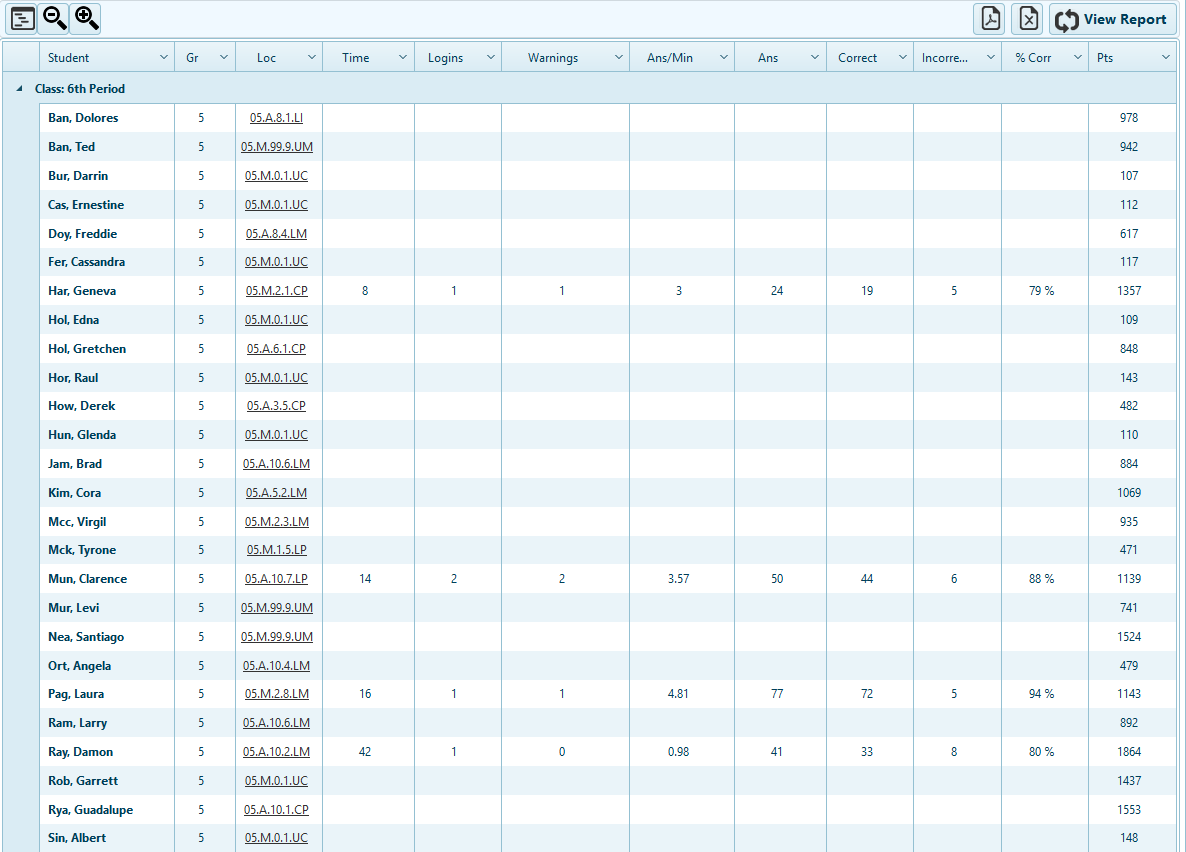
The ThinkFast! Highlights report displays the following, for the day selected unless otherwise indicated:
Student -
Name of the student
Gr -
The student’s enrolled grade level
Location -
The location of latest activity in ThinkFast!
Time -
The time in minutes of student activity in ThinkFast!
# Logins -
The number of times the student logged into ThinkFast!
Ans per Min -
The number of answers the student entered in ThinkFast!
Total Ans -
The total number of answers the student entered in ThinkFast!
Correct Ans -
The total number of correct answers the student entered in ThinkFast!
% Correct -
The percent correct answers entered by the student in ThinkFast!
Total Points -
The total number of correct answers in ThinkFast! to date.
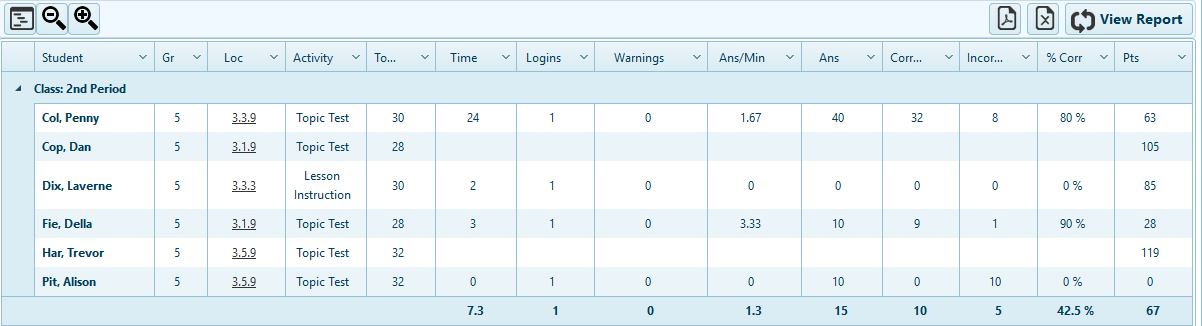
The vBook Highlights report displays the following, for the day selected unless otherwise indicated:
Student -
Name of the student
Gr -
The student’s enrolled grade level
Location -
The location of latest activity in vBook
Topic # -
The number in sequence of the topics in vBook, for the latest activity
Activity -
The latest type of activity in vBook
Time(Min) -
The time in minutes of student activity in vBook
# Logins -
The number of times the student logged into vBook
Ans per Min -
The number of answers the student entered in vBook
Total Ans -
The total number of answers the student entered in vBook
Correct Ans -
The total number of correct answers the student entered in vBook
% Correct -
The percent correct answers entered by the student in vBook
Total Points -
The total number of correct answers in vBook to date
Use the Highlights report while students are in class to monitor the program students are in, and to view quick measures on student performance.