The Class Grade Level Test Detail is available at the teacher level only. For a selected teacher-assigned Grade Level Test, it shows each student’s results by standard and description.
In iKnow, only teachers can make and assign a Grade Level assessment. School administrators can make and assign a Benchmark assessment. While both assessments are at students’ currently enrolled grade levels, the difference is that a Grade Level assessment is assigned to classes rather than to an entire school. Grade Level data are reported for a class, while Benchmark data are reported for an entire school.
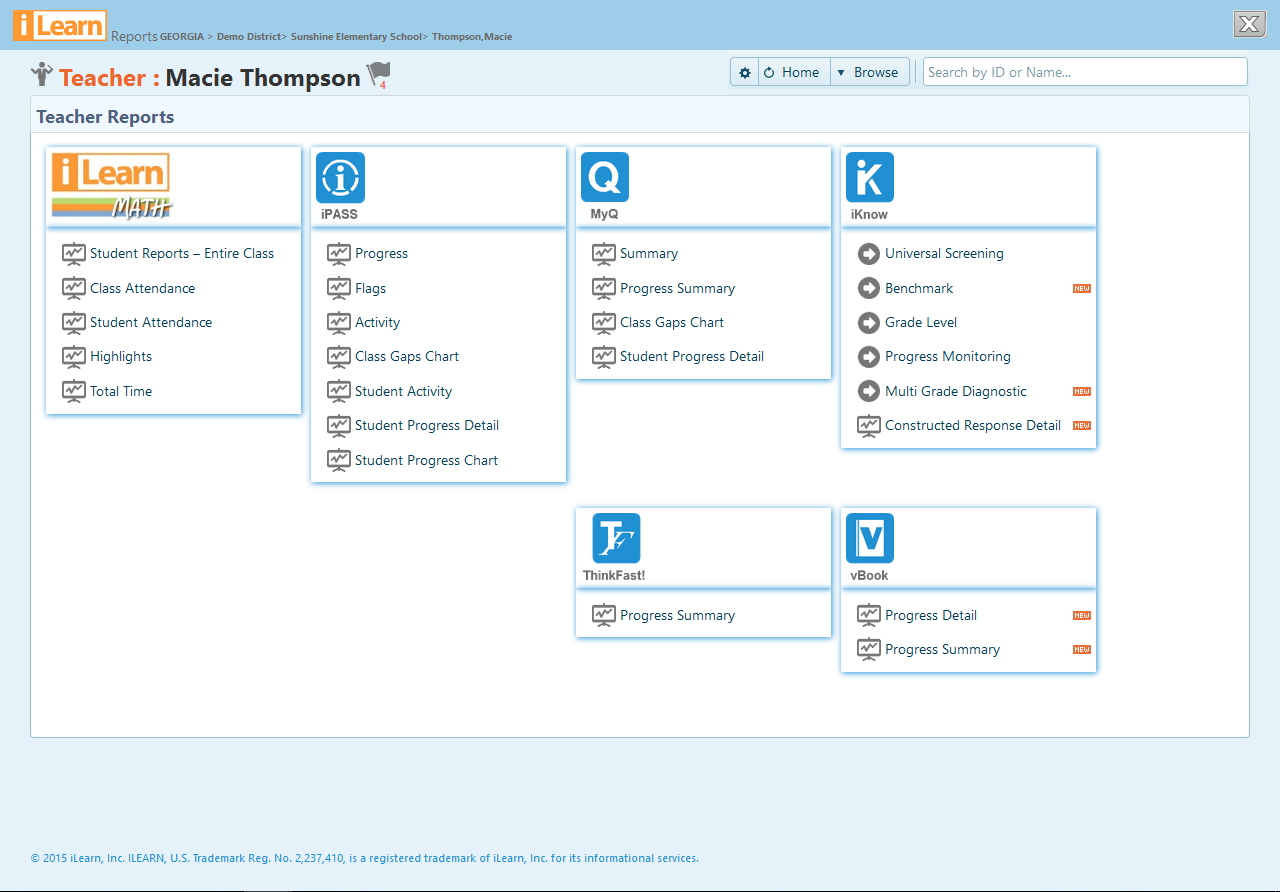
To access the Grade Level Test Detail report, log in at www.iLearn.com/login and click
Reports.
The Reports open in a new window.
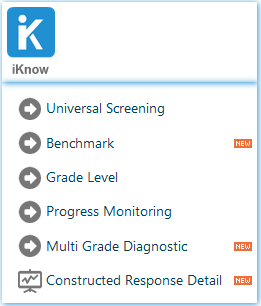
Under iKnow Math, select “Class Grade Level Test Detail.”
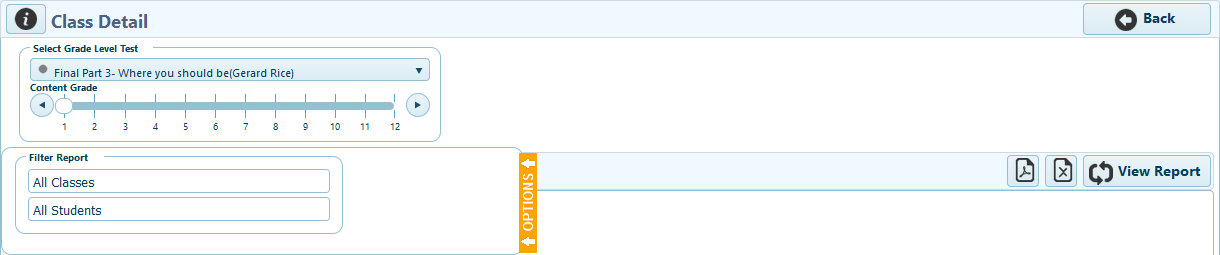
Click “View Report,” or change options then click “View Report.”
Grade Level Test – Selecting the name of the Grade Level Test to view.
Content Grade – Select the grade level. Change the grade level by clicking the number or using the arrows to the left or right of the number line.
Options – Customize the report by clicking “Options” on the left side.
Select Class(es) – Select one or multiple classes. To view two or more classes, click each class. Remove classes by clicking the “x” next to the class name.
Select Student(s) – Select one or multiple students. To view a specific student, click “All Students” then select the name. To view two or more students, select each name. Remove students by clicking the “x” next to the student name.
View Report – After changing options, click “View Report” to reflect the changes. Repeat: Always click “View Report” after changing options.
Export – Export to PDF
. Export to Excel
.
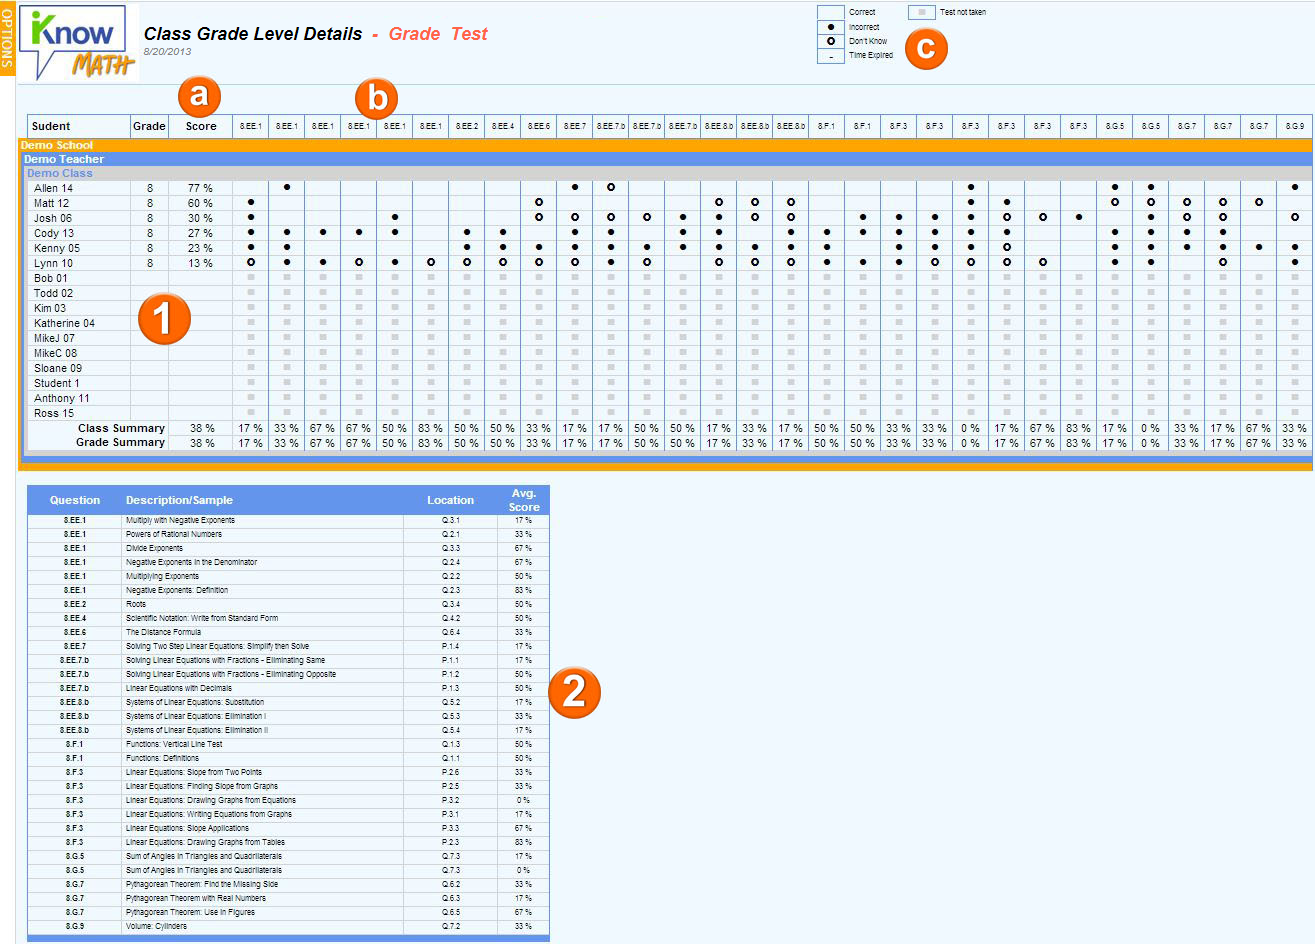
Class Grade Level Test Detail – This table shows all students in the selected class(es) and their performance on the Grade Level Test.
Score –The % correct answers
Standards –The associated standard
Key –Displays Correct, Incorrect, Don’t Know, Time Expired, and Test not Taken.
Correct answer - the cell is blank.
Incorrect answer - displays a solid circle.
Student clicks “Don’t Know” – displays an open circle.
Timer for the test expires – remaining questions display a dash “-“.
Student did not take the selected grade level– displays a light-grey box.
Legend – Shows a description of each standard, the location in iPASS and MyQ, and the average score for the standard based on the students in the report. The average score will help determine standards students struggle with most.
Use this report to see how students performed on specific standards and questions.